Financial traders use a wide array of resources and tools before making any decisions, including reading and analysing trends, conditions and price actions. These readings help them understand the market sentiment and execute buy and sell orders accordingly.
The market fear and greed index is a common tool for reading the general opinions and speculations of market participants and understanding in which direction the market is going.
How is the greed index calculated? And how reliable is it to trade using the market mood index chart? Lets discuss this and more in the following.
[[aa-cta]]
Crypto Swaps
Instant Crypto-to-Crypto Exchange
Swap between 350+ assets at VWAP pricing aggregated from Kraken, Coinbase, Binance, and Bitstamp. Execute directly from your B2BINPAY wallet — no withdrawal fees, no third-party accounts required.
[[/a]]
Understanding The Market Fear and Greed Index
The fear and greed indicator was introduced by CNN Business in 2012, measuring the market condition and traders overall emotions and activities. As the name suggests, the index measures two spectrums of the investors mood, fear and greed, which are associated with market prices.
The market becomes greedy when the demand for an asset is high and prices increase, encouraging more investors to follow suit.
On the other hand, when fear prevails due to low demand levels and decreased prices, traders are more reluctant to buy financial instruments because they do not have profitable potential.
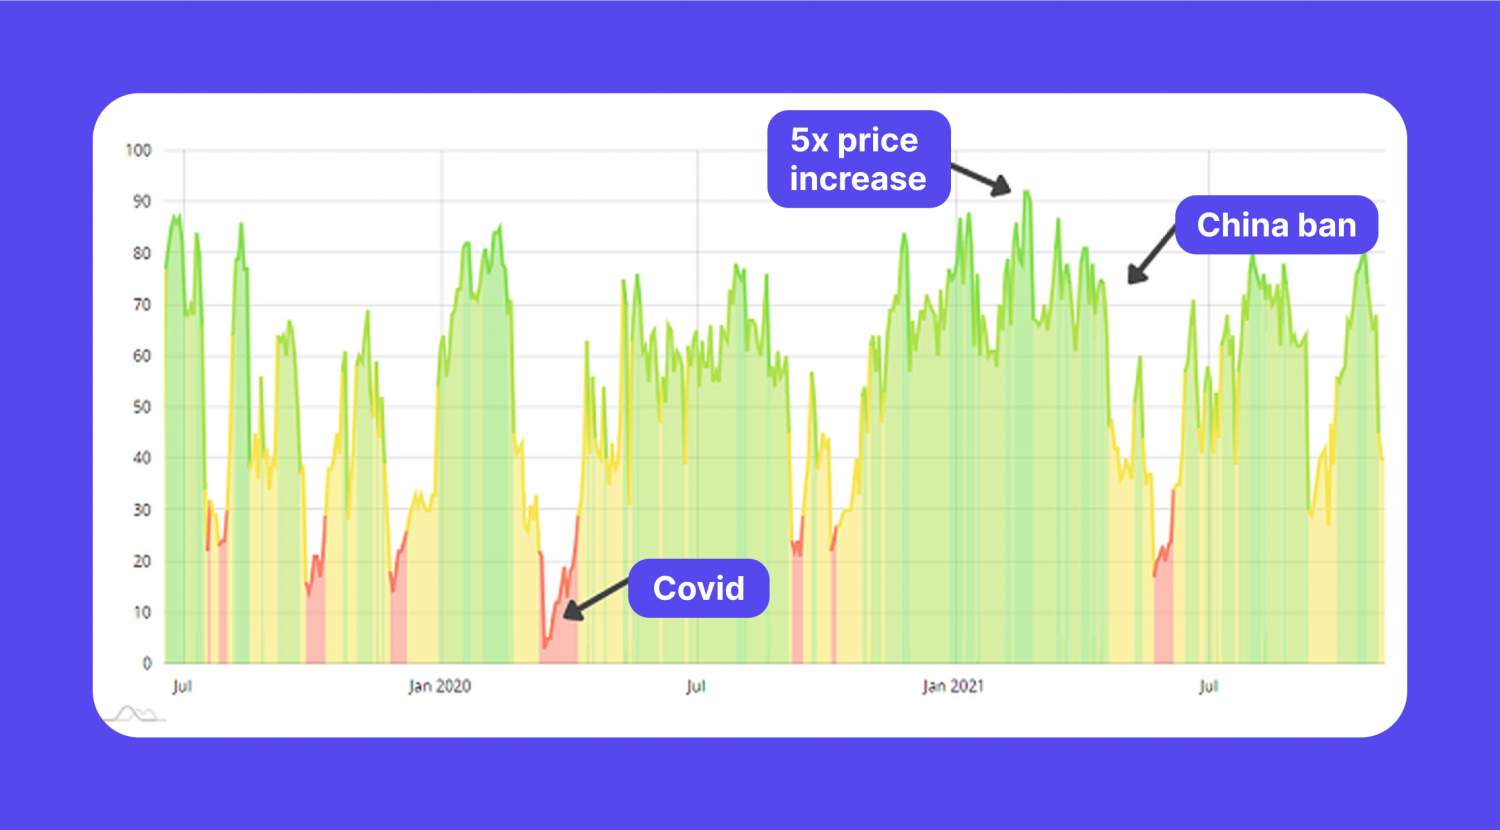
For example, during the 2020 pandemic, when most markets went down, and the stock market crashed, the fear and greed indicator was as low as 5, indicating an overall turmoil in prices and markets.
How to Use The Market Mood Indicator
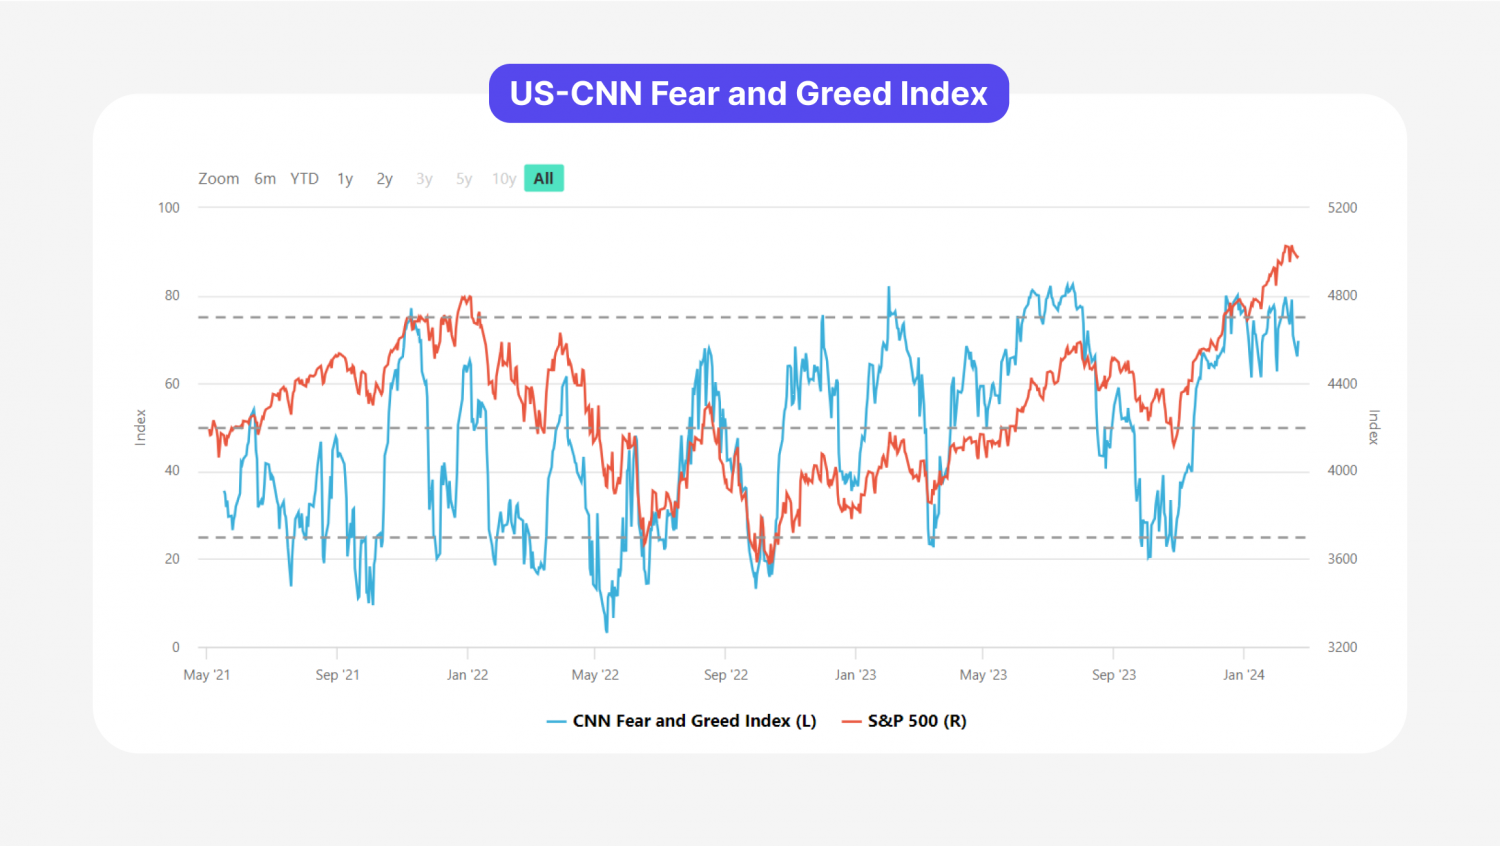
The market greed index measures the traders sentiment on a scale from 0 to 100, with 0 as Extreme Fear and 100 as Extreme Greed. The main grades on the index are 0, 25, 50, 75, 100, as shown below.

Traders can incorporate the trading sentiment index into their strategies, assisting them in making investing decisions. However, it must not be the sole source of information because it may not reflect accurate values.
During market growth, the index indicator turns green, mostly at values around 60 or more, showing a greedy behaviour pattern as traders buy more of the subject instrument or asset class.
How is The Market Mood Index Meter Calculated
The investors sentiment index is a complicated measure that uses several metrics to reflect accurate results as much as possible. In order to do so, the developers combine seven market indicators.
- Stock price strength: This indicator measures the stocks that reached 52-week highs against the 52-week lows in the NYSE.
- Stock price breadth: This indicator measures the trading volume of the growing vs declining stocks in the New York Stock Exchange.
- Stock price momentum: This signal analyses the S&P 500 index performance compared to its 125-day moving average.
- Market volatility: This indicator uses the CBOE volatility index with a 50-day moving average to measure market and price volatility.
- Put and call options: This indicator analyses the active options contracts, comparing the put against call orders, leading to bullish or bearish sentiments.
- Junk bond demand: This tool analyses the differences between the yields in junk bonds and investment-grade bonds.
- Safe-haven demand: Comparing the performance and demand on stocks against bonds to understand traders sentiments.
What Affects The Global Market Mood Index
While being calculated using different indicators and signals, unexpected market events and internal and external changes affect the market fear and greed index. Here are several factors that affect the traders sentiment indicator.

Market Trends
This is the most important and effective factor associated with the greed and fear metre, such as price action, demand changes and natural market dynamics.
When an asset becomes overbought due to an upward trend, its value increases, and the index turns green, showing a greedy sentiment or a bullish market.
Conversely, when the trend loses its momentum and drops below its average value, the market price decreases, and the metre turns red, showing fear among traders opinions.
Economic Reports
National economic figures usually drive the entire financial market direction, such as gross domestic product, inflation rates, consumer price index, and other indicators that show the economys well-being.
Consequently, if the economy is doing well, investors are more likely to expand on their investments, and the greed & fear indicator will show greed signs.
Geo-Political Conditions
Political stability plays a major role in investors confidence and likelihood of trading. During times of wars, trade wars or geo-political instability, traders become reluctant to invest their money as they are unsure about the economys future.
[[aa-note]]
VWAP (Volume-Weighted Average Price) aggregation reduces the market impact of large trades by averaging prices across multiple exchanges and order book depth levels — ensuring businesses get fair execution.
[[/a]]
As a result, financial markets break down, and tradable instruments lose their value as fear strikes investors.
Market Price Action
Other market events like trend fluctuations, price movements, previous patterns, and market trading psychology highly influence investor sentiment indexes.
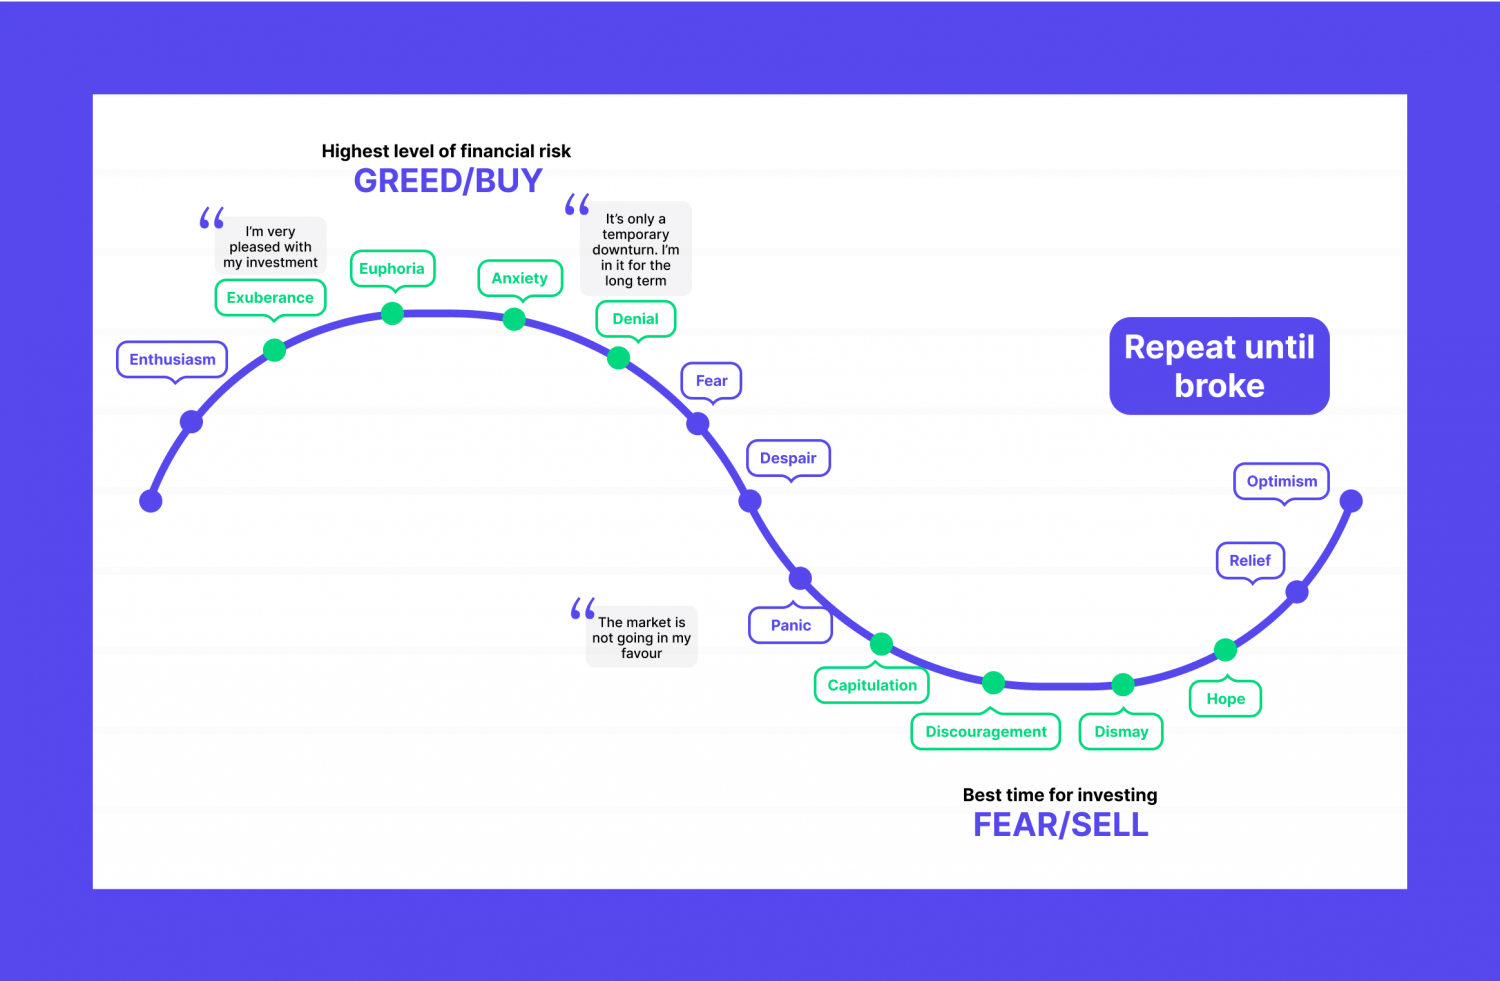
Additionally, market mood index history cycles and the belief that price events repeat themselves drive the traders motivation to expand or refrain from investing.
Moreover, market bubbles and unprecedented events can move the momentum indicator inconsistently across the spectrum, affecting market participants speculations, decisions and opinions.
Trading Strategies with The Fear and Greed Index
The fear and greed index alone is not reliable for making trading decisions. It is best used in conjunction with other indicators and signals. Most investors analyse the market mood index today or the historical changes to understand the patterns of a particular market or asset.
Finding Market Trends
Stock traders use this indicator, besides other trend-finding instruments, such as moving averages and the RSI index, to discover the overall opinion and decisions regarding a particular stock.
Based on these signals, investors can build most of their trend trading strategies to confirm or deny a potential trend and track direction shifts.
Tracking Price Actions
Investors use this indicator to verify the impact of certain news or events on the market price. Thus, besides tracking the charts in detail and identifying price shifts, the investors mood index can reveal if the market action has impacted the traders decisions and purchase activities.
Identifying Deviations
The sentiment index tracks the changes in investors confidence as the stock prices shift.
For example, by tracking the market mood index history and comparing it to all-time highs and lows of Apple stocks, traders can understand if theres a reversal or an increase in investors appetite for a specific asset.
This signal can also uncover market volatility by tracking previous indicators and measuring the sentiment changes across different timelines.
Risk Assessment
The market momentum index can be used as a risk analysis tool. If the market mostly resides in the red area or under the score of 50, this suggests that participants are mostly reluctant to invest and buy assets, referring to higher risks.
On the other hand, if the traders confidence is usually high and the index shows greed, it means that risks are low or manageable and traders are motivated to increase their purchase activities.
Determining The Entry and Exit Points
Traders can choose their entry and exit points according to the changes in the fear and greed index. When the confidence level starts increasing and changing from fear to greed, it marks an opportunity to enter the market and capitalise on the positive trend.
However, when the indicator shows extreme fear or extreme greed, this might mean that the asset is oversold or overbought, and a trend reversal can be due at any time, marking a chance to enter or exit the market.
Final Remarks
[[aa-cta-blue]]
Merchant Wallet
Zero Chargebacks. Flat Fees. Global Reach.
Blockchain payments are irreversible by design — no chargebacks, no fraud disputes. Accept 70+ tokens from customers worldwide and settle in fiat the same day. Trusted by 1,000+ businesses on B2BINPAY.
[[/a]]
The fear & greed index is a technical indicator that shows the investors confidence in trading a particular asset or in a specific market. It is calculated based on different indicators and signals that track price changes and trend strength and volatility.
The market mood indicator reflects a figure between 0 and 100, starting from extreme fear to fear, neutral, greed and extreme greed. The index shows a score below 50 when the market is uncertain, and traders are unsure about investments, while the greed indicator shows during an economic recovery and when market prices increase.

.svg)