

The cryptocurrency market has been on a rollercoaster so far in 2024, with Bitcoin leading the way as its price surged by over 10% in just one week in February, exceeding $60,000. The high demand for Bitcoin exchange-traded funds (ETFs) is driving this rally, with over $4 billion already invested in various BTC ETFs. More and more traders are turning to crypto, looking to capitalise on its growth potential.
One of the fundamental strategies these traders employ is the analysis of crypto resistance and support levels, serving as the linchpin for analysing price movements. They often act as price barriers where market sentiment is visibly reflected.
This article will explore the methods traders employ to calculate key pivotal points and identify these essential barriers, utilising top indicators for these strategies.
[[aa-cta]]
Crypto Payment Gateway
Crypto Payments for Every Business Model
Whether you run an e-commerce store, SaaS platform, brokerage, or marketplace — B2BINPAY provides a turnkey crypto payment solution. 350+ assets, 20+ blockchains, automated fiat settlement.
[[/a]]
What is a Support Level?
In crypto trading, a support level is often likened to a safety net, a price point where a surge in buying interest cushions a potential fall in the asset's value.
This level represents a psychological threshold where the market collectively agrees the asset is undervalued, prompting traders to purchase rather than sell, thereby preventing the price from dropping further.
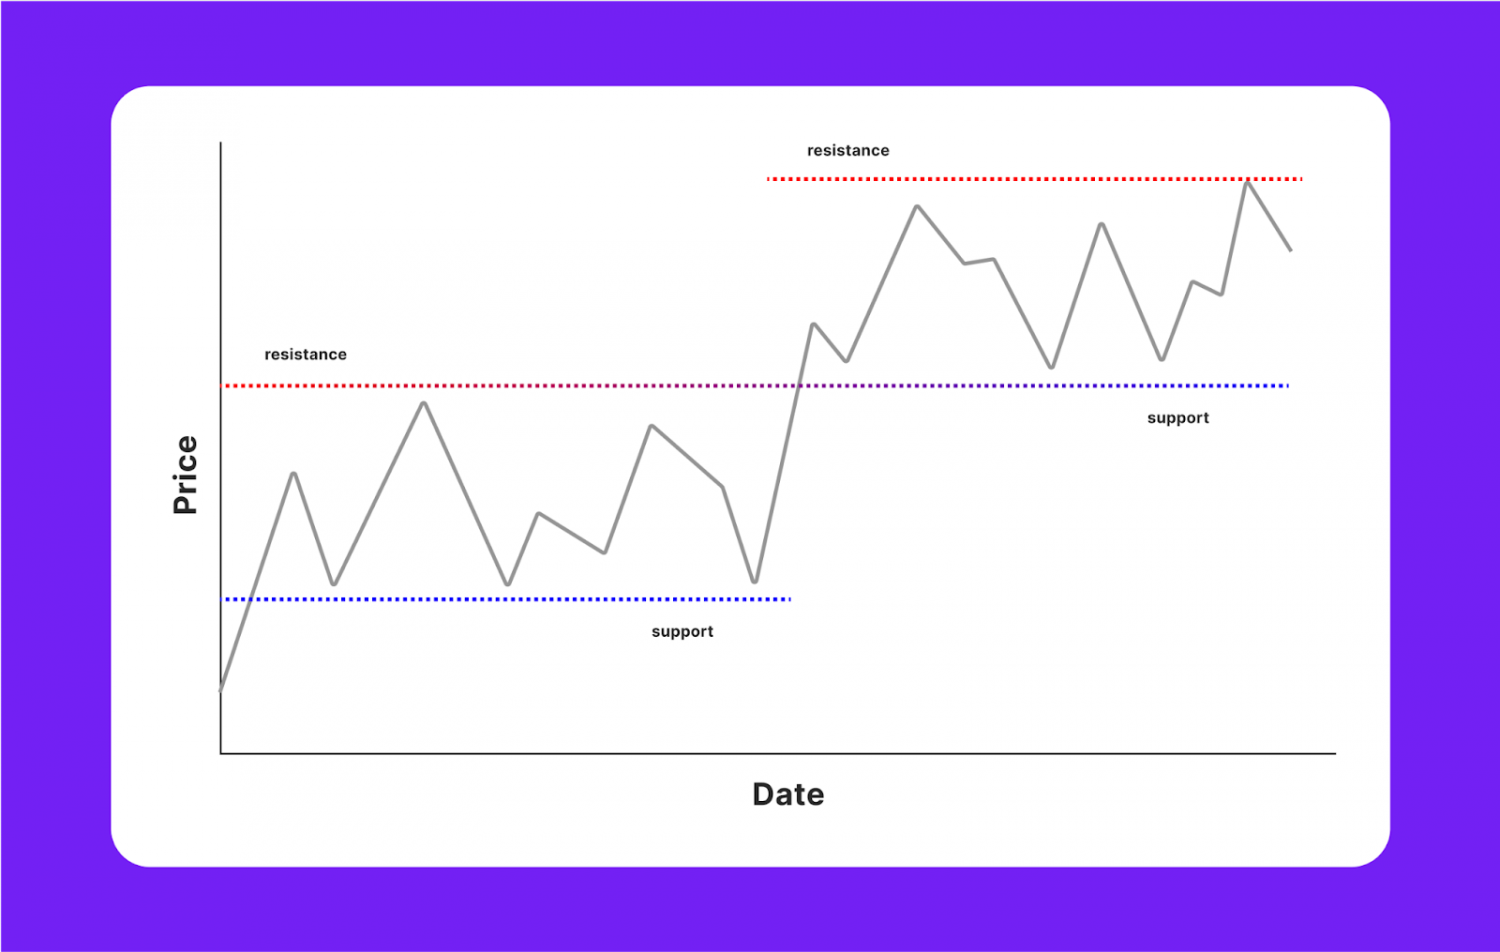
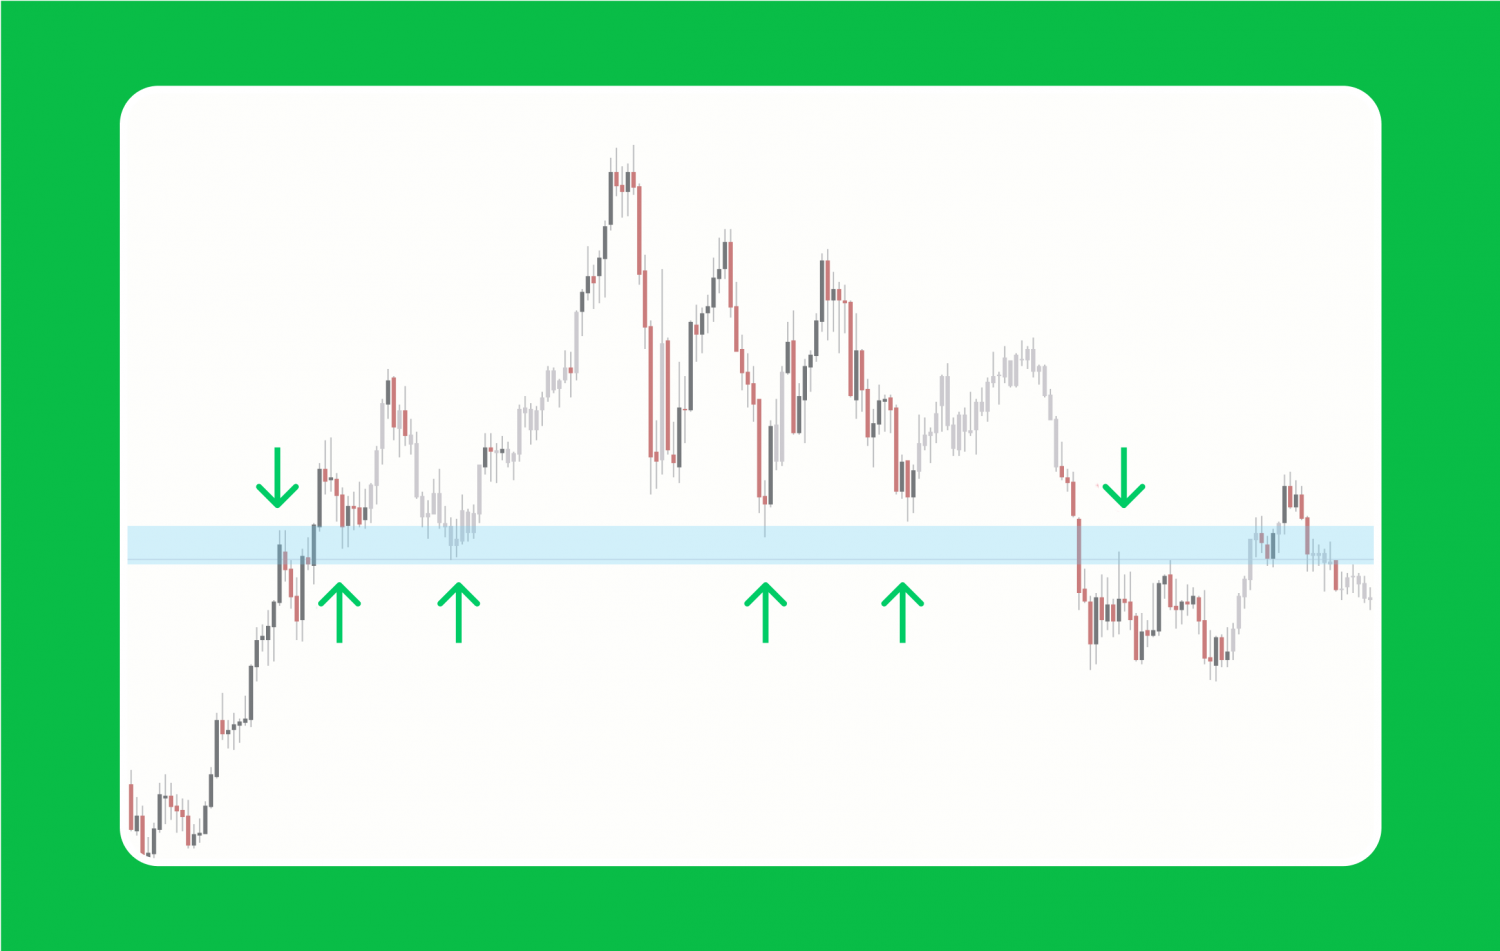
Support Level on a Chart
Traders examine historical information to determine in which area an asset has previously experienced considerable buying pressure, keeping it from falling below a certain price. These past price points are connected using a horizontal line on a price chart, crafting an illustration of the support level. It's akin to drawing a line under previous price lows, which then serves as a reference for future trading decisions.
Changing Dynamics of Support Levels
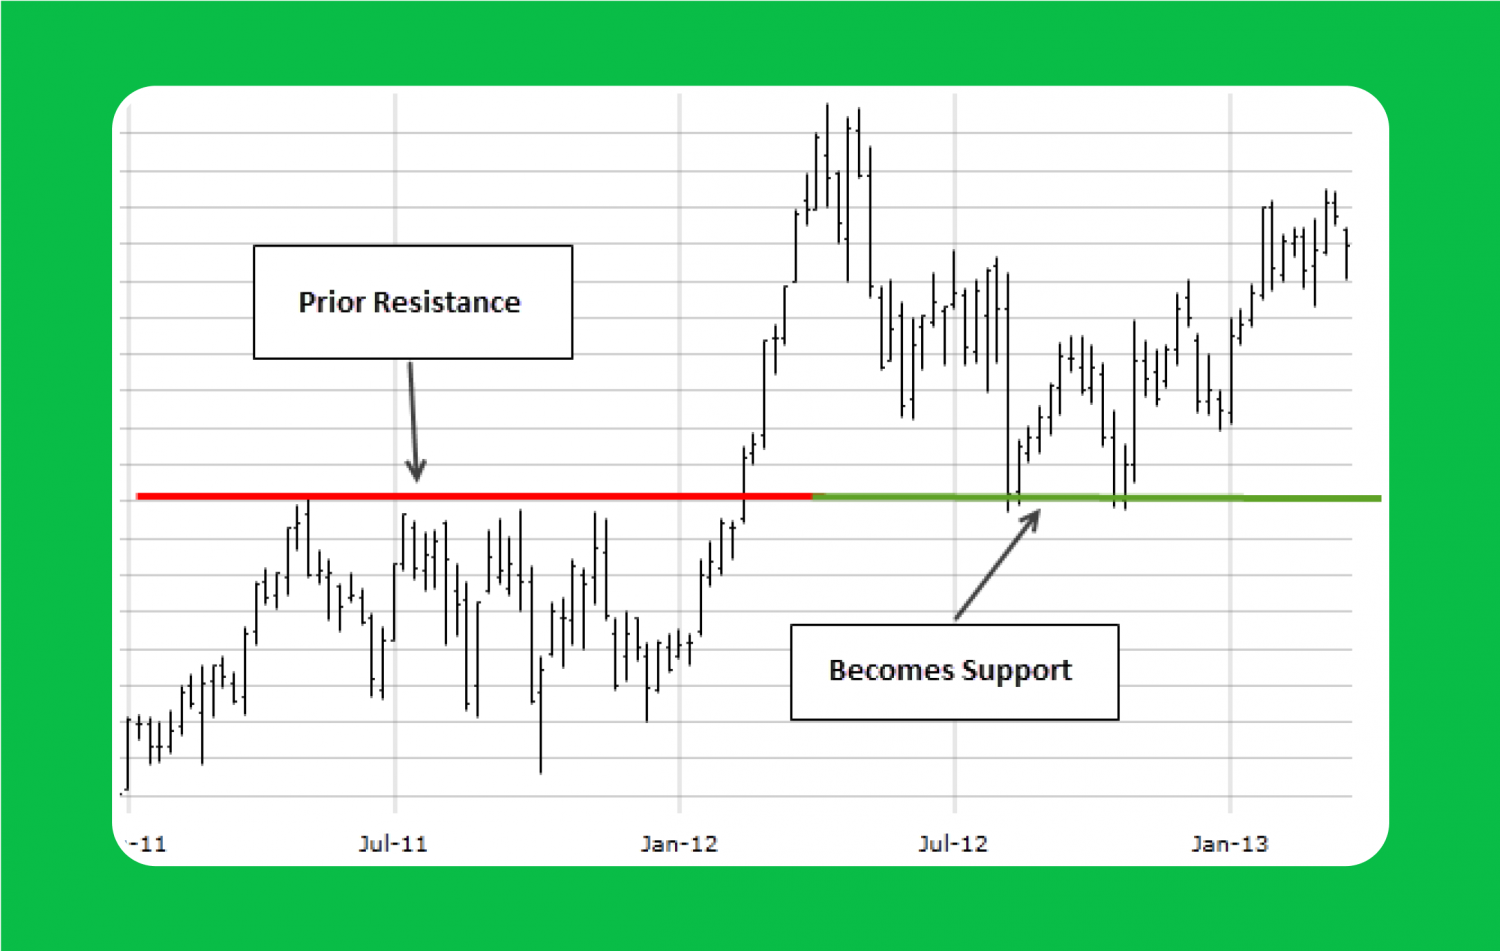
The dynamics of support levels dictate that if the price of a cryptocurrency breaks through its established floor, this level can transform into a new resistance level. This shift exemplifies a change in market sentiment, where what was once a floor now becomes a ceiling, indicating an altered momentum in price movement.
Market Psychology Behind Support Levels
Human behaviour plays a pivotal role in the formation of supports, with round numbers often acting as psychological anchors. Traders are drawn to these round figures, viewing them as milestones or targets, which in turn can solidify these levels as floors in market value.
What is a Resistance Level?
In cryptocurrency trading, a resistance level acts much like a ceiling, halting the upward trajectory of an asset's price due to a confluence of selling pressure. As traders observe the asset reaching these higher echelons, many choose to cash in on their positions, increasing supply and preventing the price from climbing further.
These critical levels in trading are often spotted by charting the previous highs that the asset struggled to surpass, painting a clear picture of where traders have previously placed a cap on the price.
Upon encountering a resistance level, traders may opt to enter a short position if the price is rejected at this level, anticipating a potential drop.
Conversely, if the resistance level is broken, traders face a choice: trade aggressively by entering a long position in anticipation of a continued uptrend or adopt a conservative stance, perhaps waiting for a retest of the newfound support level before committing.
Resistance Level on a Chart
To visualise resistance levels, traders draw a line connecting the highest peaks over a selected time frame. This line represents a price point that the cryptocurrency has touched but not exceeded, serving as a signal for traders to consider potential sell orders.
The Interpretation of Resistance
Interpreting resistance levels can vary among traders, as they might use different technical indicators to identify these points. Some might look at round numbers, which often serve as psychological barriers due to market participants' propensity to focus on them, while others might employ moving averages (MA) or trendlines.
Changing Dynamics of Resistance Levels
When a resistance level is breached, it often transforms into a support, creating a new "floor" that can keep the price from falling. This occurrence can signal a trend reversal. Such breakouts from resistance levels can be seen as opportunities for traders to either enter new positions or adjust their existing ones, depending on their individual trading strategy and risk appetite.
Market Psychology Behind Resistance Levels
Market psychology greatly influences the establishment of resistance levels, with concepts such as anchoring influencing where these levels might form.
Traders' collective focus on certain price points can create self-fulfilling predictions, as these become targets for selling or taking profits. Recognising and understanding the psychological underpinnings of resistance and support can offer traders an edge in navigating the complex and often unpredictable crypto market.
Ways to Trade Support and Resistance
Here's how traders can harness the power of these levels, creating strategies around determining the corresponding levels of support and resistance.
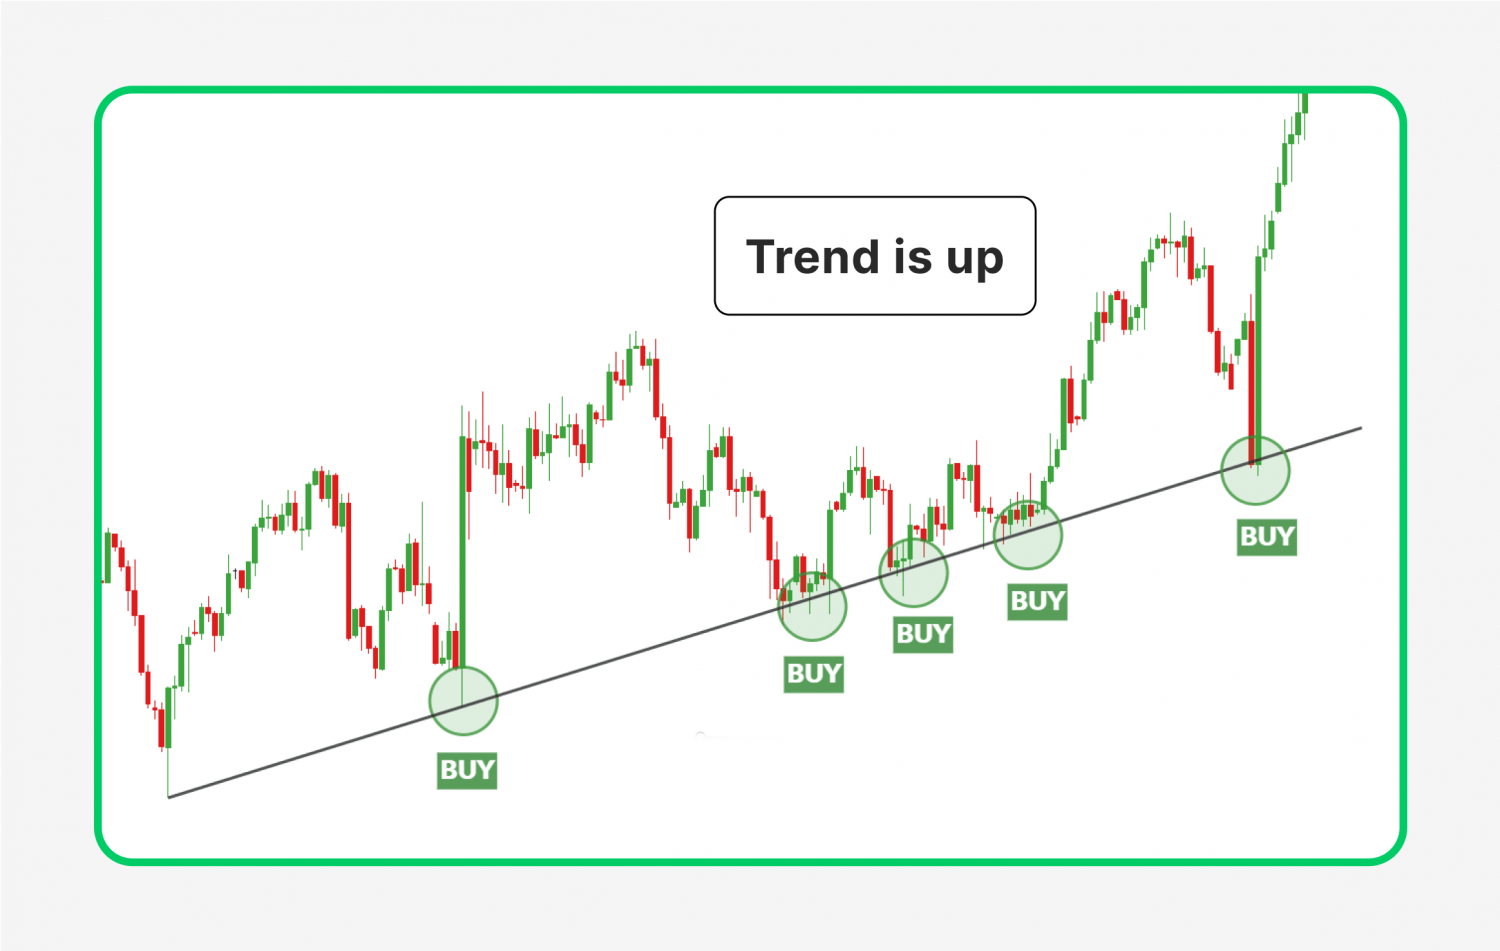
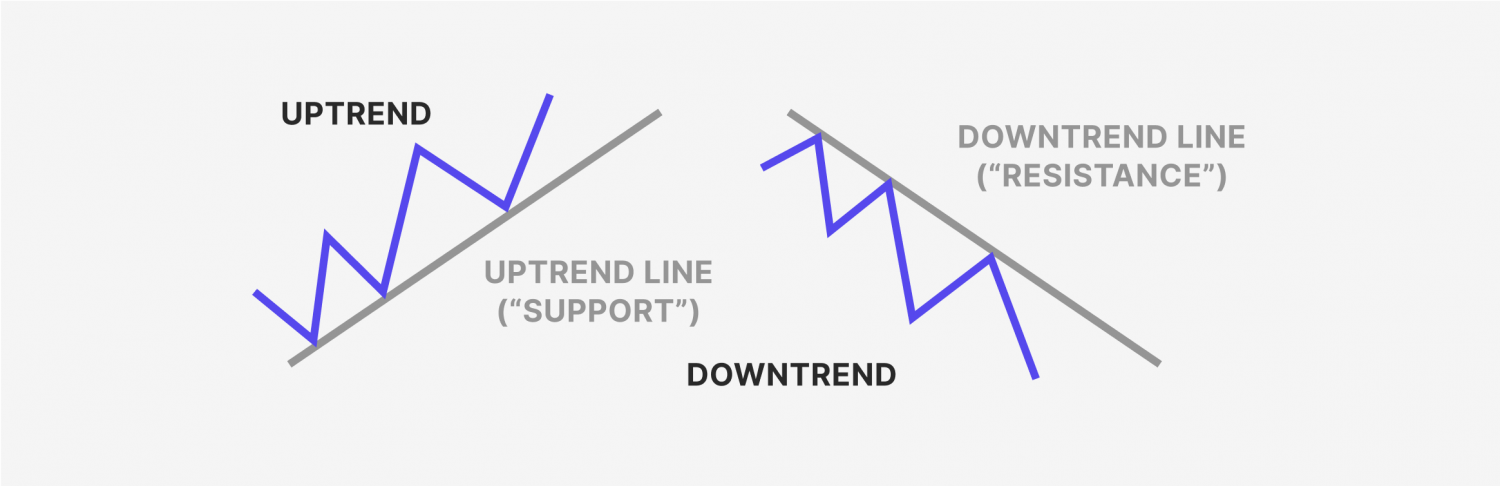
Determining Trendlines
Before traders can effectively identify reversals and use them in their strategies, they must establish the trendline. A trendline, whether indicating an upward or downward direction, provides context for the current trajectory of asset prices. By drawing these lines, a trader can identify the general market direction and prepare to identify key levels in trading.
Trading at Key Levels
Conventional wisdom suggests that you should buy at support and sell at resistance. However, accurately locating these areas can be challenging sometimes.
Traders often use a range of tools to define these zones, such as MAs, which smooth out price data to reveal a more apparent trend, and Fib retracement levels, which mathematically divide price ranges into key ratios that often align with these levels.
[[aa-note]]
Stablecoins now represent over 70% of all crypto payment volume by value, as businesses and consumers prefer price-stable tokens for transactional use while holding volatile assets as long-term investments.
[[/a]]
High trading volume near these levels can further reinforce their significance, indicating a strong consensus among traders about the asset's value.
Best Indicators for Support and Resistance
In the quest to master the support and resistance formula, traders have at their disposal a variety of technical indicators that can significantly assist them in identifying key levels in trading.
Here are some of the most effective indicators used by seasoned traders:
Trendlines
By connecting a series of lows for support or a series of highs for resistance, trendlines make it visually apparent where the market sentiment has historically prevented an asset's price from moving past certain points. They help traders calculate pivot points that are vital in determining future market movements.
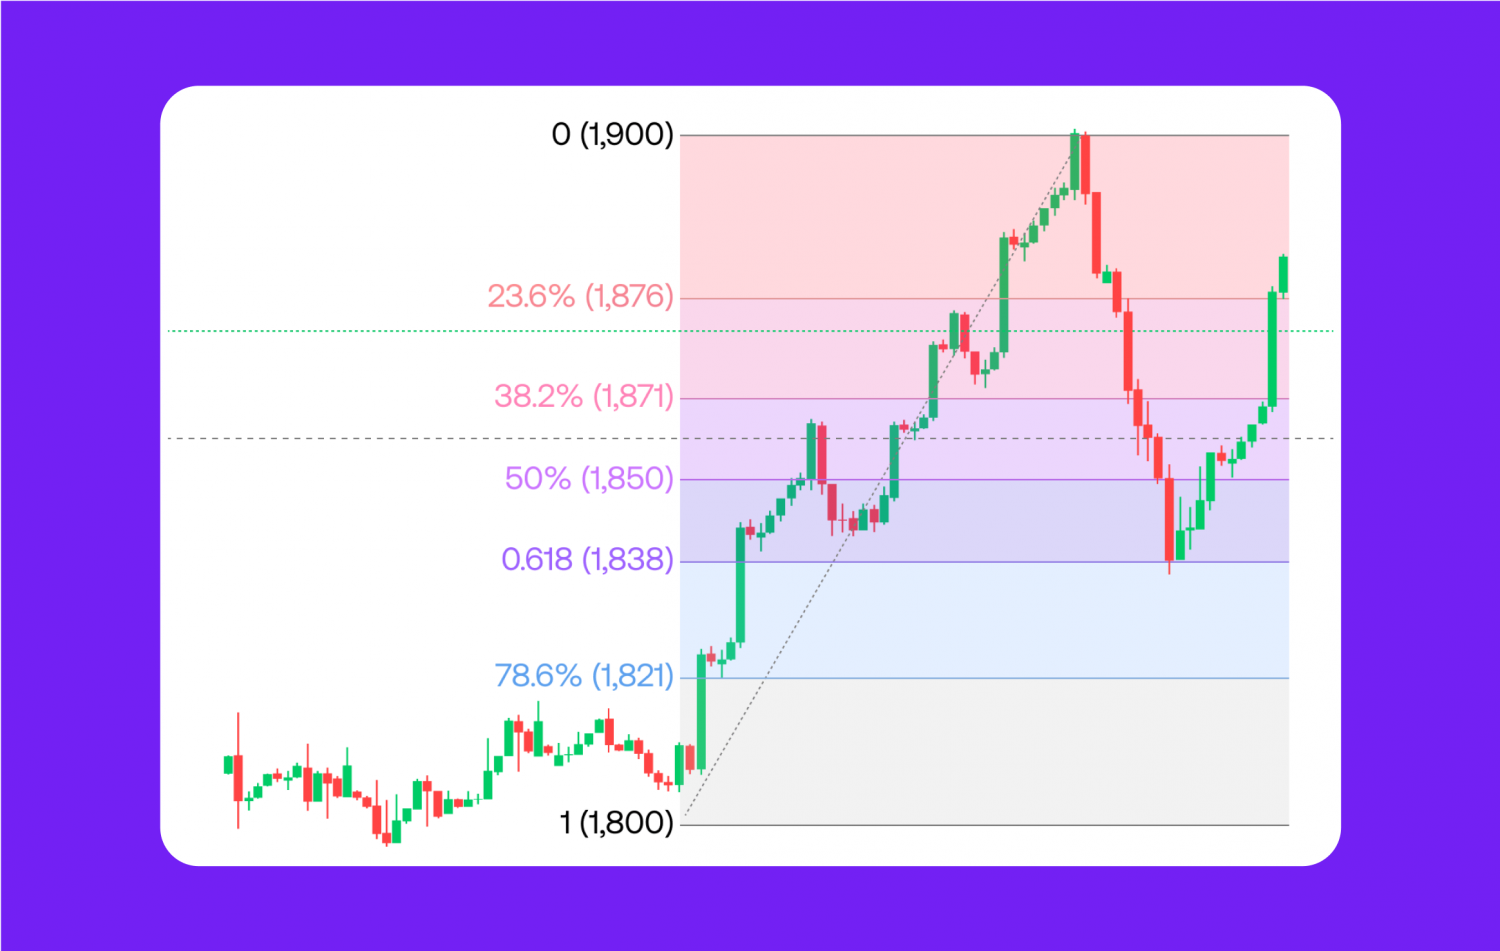
Fibonacci Retracement
A favourite instrument, the Fib retracement, is based on the idea that markets will retrace a predictable portion of a move, after which they will continue to move in the original direction. By plotting these levels between the high and low points of an asset's price, investors can spy support and resistance lines that align with the Fibonacci numbers.
Moving Average
This indicator smooths out price action over a specified period, providing a clearer view of the overall trend. An MA can act as dynamic support or resistance: if the value of an asset consistently bounces off a moving average line, that level is confirmed as a significant one. The longer the time frame for the MA, the stronger these levels can be.

In addition to these, the following indicators are also widely used to identify robust support and resistance zones:
- Auto Fib: This support resistance indicator automatically draws Fibonacci retracements graphically, saving traders time and helping to ensure accuracy in determining reversal areas.
- Pivot Point: This tool is used to calculate pivot points based on the high, low, and closing prices of the previous trading session. The pivot point itself can be considered a level of support or resistance, with additional levels calculated above and below it.
- Fibonacci Bollinger Band: An amalgamation of Fibonacci ratios and Bollinger Bands, this indicator provides varying levels of support and resistance and can be particularly useful in volatile markets.
Why Is It Important Using Multiple Indicators?
It's crucial to remember that while these indicators are powerful, they are not foolproof. The difference between support and resistance is sometimes subtle, and levels can be broken or reversed.
Thus, traders often look for confluences between different indicators to strengthen their analysis. For instance, support that coincides with a key Fibonacci retracement level and an MA could be considered a robust zone for potential buying opportunities.
Similarly, a resistance price level that aligns with a significant Fibonacci number and is reinforced by a trendline may be a strong candidate for placing sell orders.
What Strategy to Use?
The indicator for support and resistance is a cornerstone of crypto trading, offering an invaluable glimpse into market behaviour. Here are some strategies that leverage these crucial indicators:
Buying Near Strength Levels
Traders often look for opportunities to buy during price descents to a support level. This area, marked by a concentration of buyers, suggests the asset is undervalued, making it an attractive entry point. The rationale is that the price is expected to bounce back up from this level, providing a favourable risk-reward scenario for the trader.
Selling Near Resistance
Conversely, when the price nears a resistance level, traders might consider selling or opening a short position. The abundance of sellers at this level indicates that the market considers the asset overvalued, and the price may struggle to climb higher.
This strategy can be particularly effective when the price action shows signs of stalling or reversing at the resistance.
Breakouts or Breakdown
A breakout occurs when the price crosses over a resistance level, potentially signalling the start of a new uptrend. Traders may take this as a cue to enter long positions. Similarly, a breakdown happens when the price falls below a support level, which could indicate the beginning of a downtrend, prompting traders to sell or short the asset. In both cases, it's essential to confirm the move with high trading volume, which adds credibility to the breakout or breakdown.
Risk Management
Managing risk is integral in crypto trading, so its implementation in ones trading strategy should be a priority.
For instance, a stop-loss can be placed just below a support level when entering a long position, minimising potential losses if the price drops. Conversely, a stop-loss might be set just above resistance for a short position, protecting against unexpected upward price movements.
Advanced traders might also consider dynamic levels, where indicators such as MAs adapt to changing price movements and can offer a more fluid approach to pinpointing key zones. After major shifts, the roles of support and resistance can flip, a concept traders should be ready to act upon.
What to Remember When Looking for Crypto Trading Levels?
[[aa-cta-grey]]
Merchant Wallet
Your Payment Gateway. Your Rules.
Customisable crypto checkout, automatic token conversion, and settlement in your preferred fiat currency. No rolling reserves, no holding periods. B2BINPAY is purpose-built for high-volume merchants.
[[/a]]
While crypto resistance and support levels serve as a guide, they are not infallible. Incorporating stops and limits based on these levels can help manage risk, while pending orders can capitalise on anticipated price movements. Corrective structures, which emerge from the ebb and flow of prices against these levels, can also help investors make educated decisions.
Understanding and applying these strategies will improve the returns of a trading or short-term investing strategy, making the support and resistance formula a vital component of a trader's toolkit.

.svg)


